








Case studies

What the Radar changes, in full numbers

Three accounts we have engineered, before and after. Client names stay private. The numbers do not.

How these were built

Every client below is referenced only by sector and geography, for example “a US online vocational-education advertiser.”No account names, account IDs, campaign names, or personal data appear anywhere. The figures are real and belong to the operator’s track record: they are proof of the work, not identifiers of any client.

Selected brands the operator behind Ascensa has run media for

Cala
CCS
Aprende
LinkedUp Sales
Café Caribe
Travelsale
Purifika
GHfly
Balance
Cala
CCS
Aprende
LinkedUp Sales
Café Caribe
Travelsale
Purifika
GHfly
Balance
01US online vocational-education advertiser

From a funnel nobody could price to a measurable cost per customer

Before

The business was buying leads and closing sales, but it could not answer the two questions that decide whether paid media is a growth engine or a slow leak: what a new customer actually costs, and whether that customer is worth more than what it costs to acquire them. Spend, leads, and revenue lived in separate places. There was volume, but no line connecting a dollar in to a customer out, and no read on whether student lifetime value justified the acquisition cost.

The Radar

The diagnostic did one thing first: it rebuilt the funnel end to end so every dollar became traceable. That exposed the real unit economics instead of surface metrics. True cost per lead was $13.54, and once the funnel was measured through to closed sales, the real customer acquisition cost came out at $197 against a lifetime value that put the LTV:CAC ratio at 2.01. With the economics finally visible, the fix was structural, not cosmetic: a Lead Ads setup feeding a 1% Lookalike audience, so acquisition targeted the people who most resembled real buyers rather than the widest reachable pool.

After

$13.54
cost per lead, 1,485 leads
$197
customer acquisition cost
2.01
LTV:CAC ratio

102 sales closed on $20,110 of spend, $40,377 in attributed revenue, and a 30% sales lift once the Lookalike 1% plus Lead Ads strategy went live. The account went from “we spend and we sell” to “we know what a customer costs, we know they are worth roughly twice that, and we know which lever moved sales up 30%.”

Takeaway

You cannot optimize what you cannot price. Making CAC and LTV:CAC visible turned guesswork into a repeatable engine.

02LATAM sports retailer

Managing hundreds of live campaigns with one clear read of the account

Before

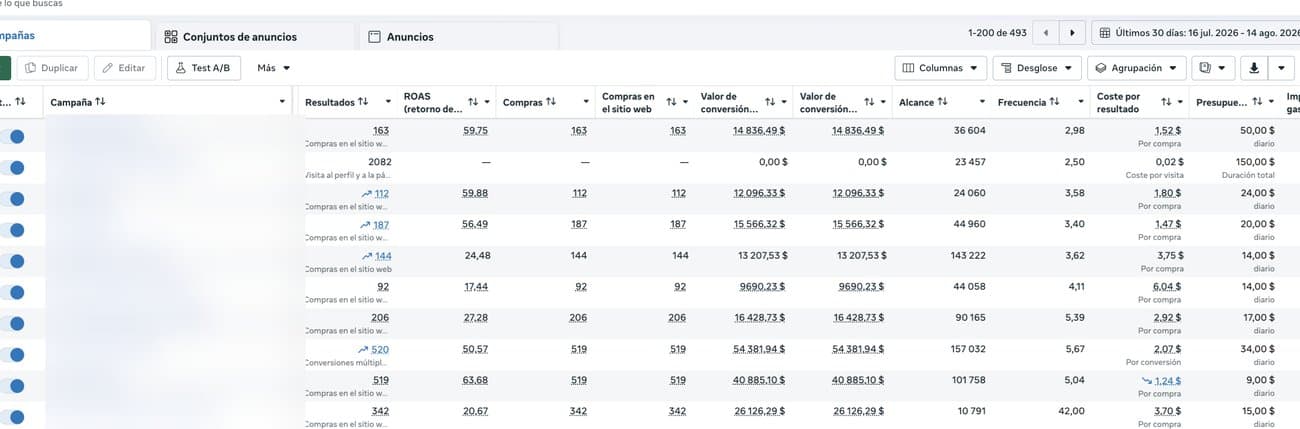
This was not an account short on activity. It was an account short on clarity. With roughly 493 campaigns running at once across catalog, sale, and retargeting, the real risk was not too little performance, it was losing the signal in the noise: not knowing which structures were doing the work, which were overlapping, and which numbers could actually be trusted for decisions.

The Radar

The diagnostic read the account at scale and separated warm-audience, brand-driven demand (catalog and retargeting to people already close to purchase) from everything else, then organized the structure so each campaign type could be judged on its own terms. Stated honestly: the returns below are platform-attributed on catalog and retargeting campaigns, where the audience is warm and much of the intent already exists. They are not a promise of what cold acquisition returns, and they are not presented as replicable to any account. The value of this case is the management, reading and ordering hundreds of live campaigns so the account is legible and controllable, not the size of any single multiple.

After (platform-attributed, warm-audience catalog/retargeting)

50x+ ROAS, platform-attributed on catalog and retargeting, across nearly 493 live campaigns.

  • Sale campaign: ROAS 63.68 on $40,885 conversion value
  • High-ticket campaign: ROAS 50.57 on $54,381 conversion value
  • Special-day campaign: ROAS 59.88, 112 purchases, $12,096
  • Scope managed: ~493 active campaigns in the account
Real Meta Ads panel · 1 of 493 campaigns
Real Meta Ads panel, one of 493 campaigns, account and campaign names blurred for privacy
Account and campaign names blurred for privacy. ROAS and conversion values untouched.

Takeaway

At scale, the win is not a magic multiple. It is a structure you can read, trust, and steer.

03Aesthetic clinic running medical tourism (LATAM)

From a trickle of WhatsApp inquiries to a measurable, high-volume patient pipeline

Before

A clinic attracting foreign patients for aesthetic procedures was generating demand the way most do: a handful of WhatsApp conversations, 10 to 15 leads a month, with no read on what it cost to bring a patient in or how those leads were actually arriving. The commercial team could close, but they were being fed a trickle, and nobody could say which dollar of ad spend produced a real inquiry. Acquisition was flying blind.

The Radar

The diagnostic rebuilt the message-to-lead flow end to end and made cost per lead visible for the first time, so every WhatsApp conversation could be traced back to spend instead of arriving as an unattributed accident. Once the flow was clear and measurable, the job split cleanly: paid media's role was to produce qualified inquiries at a known, controllable cost and at real volume, and the clinic's commercial team kept the role it was already good at, closing patients into procedures.

After (within 2 months)

114/mo
leads, up from 10-15/month (8x-10x volume)
<$1
cost per lead
30-32%
commercial close rate into procedures

The clinic went from a blind trickle to a pipeline it can read: known cost per lead, eight to ten times the volume, and a close rate that turns that volume into booked procedures.

Real Meta Ads panel
Real Meta Ads panel, account and campaign names blurred for privacy
Account and campaign names blurred for privacy, the figures untouched.

Takeaway

Knowing what a patient costs is the difference between spending and investing. Once the flow was measurable, volume and close rate did the rest.

Your account, next

The same Radar, run on your real campaigns

16 dimensions audited, findings ranked by economic impact, and a 45-minute session included. Delivered in 48 hours, with a 100% money-back guarantee.